Exoplanets and Stars
Introduction
Background and Motivation
The discovery of exoplanets—planets orbiting stars beyond our solar system—has opened new frontiers in astronomy. These distant worlds offer a lens into planetary formation, evolution, and the conditions that might support life. This project investigates how stellar properties, such as mass, luminosity, and temperature, influence key planetary characteristics, particularly equilibrium temperature. Additionally, we assess how the detection method affects the observed properties of exoplanets. These questions are critical for understanding the formation and diversity of planetary systems across the galaxy.
This study uses observational data sourced from the NASA Exoplanet Archive, maintained by the California Institute of Technology under contract with NASA. The dataset includes 869 exoplanets and a wide array of associated stellar and planetary variables, allowing for both exploratory and statistical analysis.
The dataset provides rich, well-documented features, including:
This enables us to examine not only trends within individual variables, but correlations, group differences, and predictive relationships between stars and the host planets.
The main goal of this project is to explore the statistical relationships between stellar and planetary characteristics. Specifically, we address the following questions:
To address these questions, we use the following variables and statistical tools:
To prepare the dataset for analysis, we performed several cleaning and preprocessing steps using the dplyr and tidyverse packages in R:
The Hertzsprung–Russell (HR) diagram is a foundational tool in stellar astrophysics. It plots stellar luminosity (log scale) on the vertical axis against effective temperature on the horizontal axis.
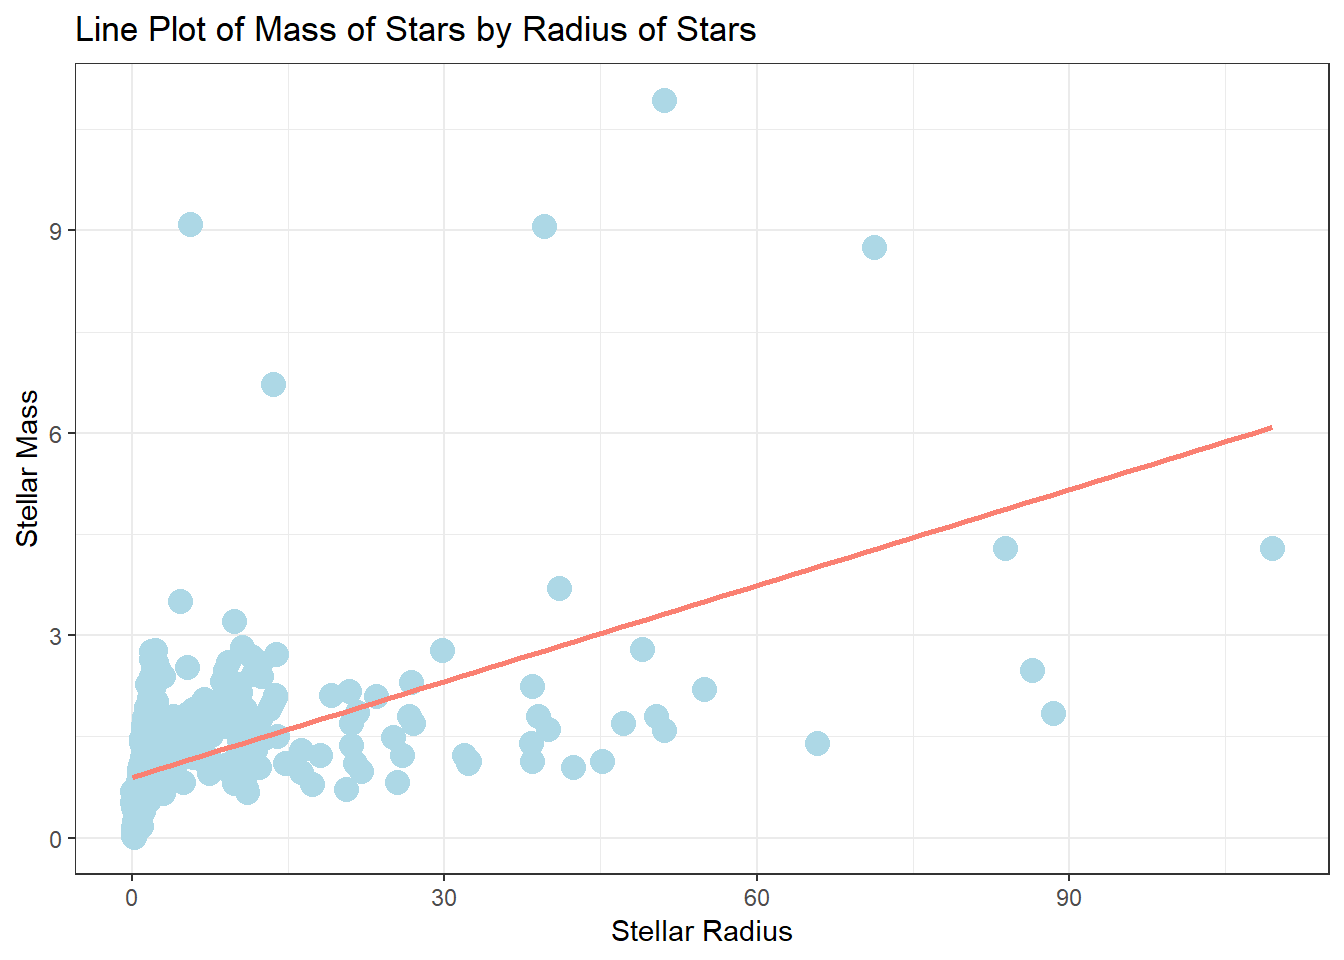
The plot has the relationship between stellar mass (y-axis) and stellar radius (x-axis):
This analysis gives insights into the internal structure and composition of stars scale with size, aiding in modeling stellar dynamics and evolution.
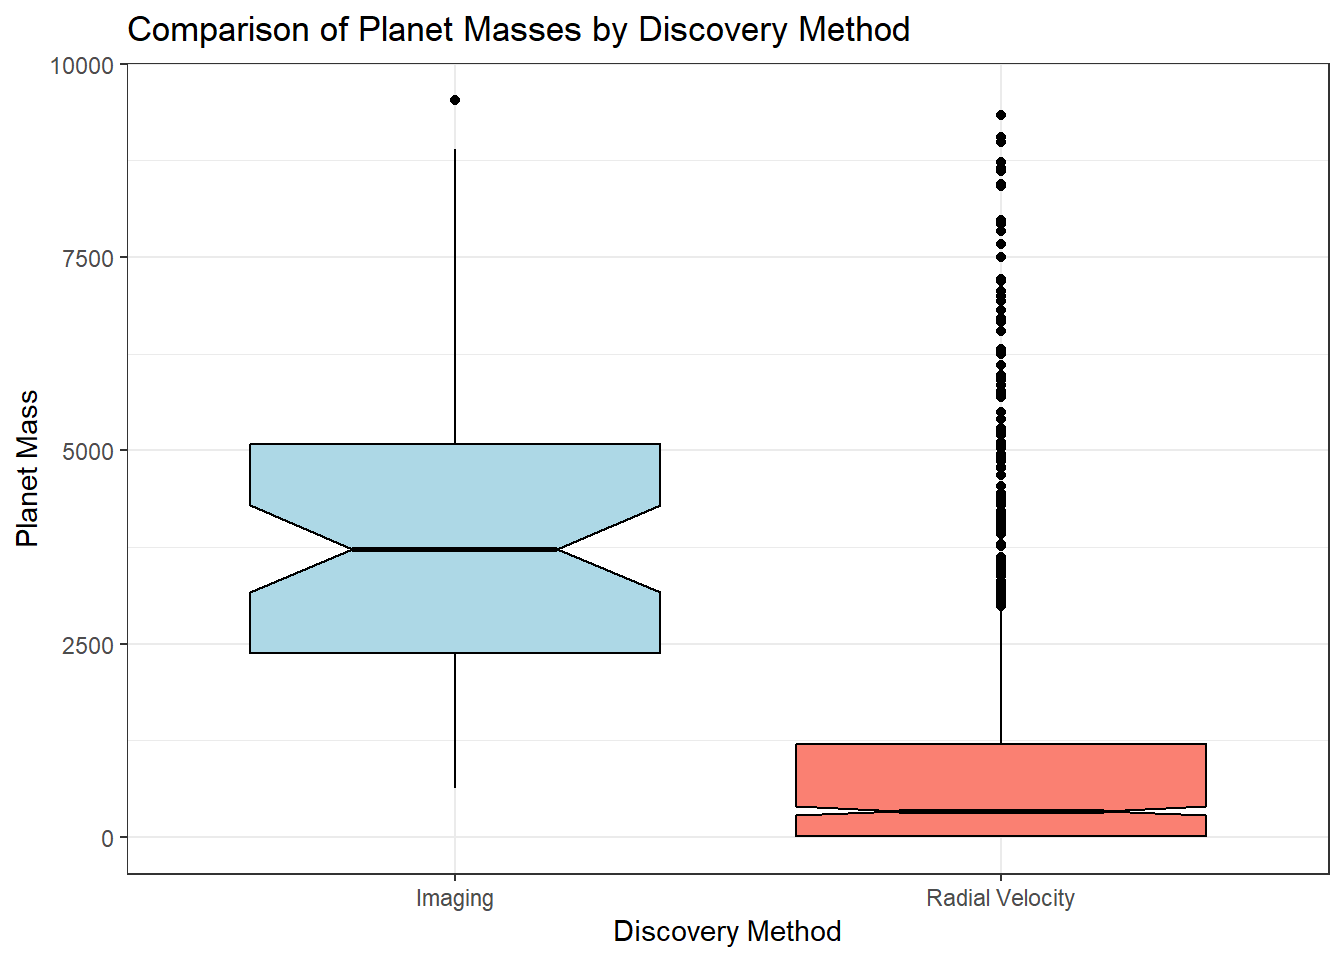
To examine whether the method of discovery influences the mass of discovered exoplanets, we performed a t-test comparing planet masses detected by Imaging versus Radial Velocity.
Estimated Mean (Imaging) | 3937.4 |
Estimated Mean (Radial Velocity) | 1011.4 |
Statistic (t-value) | 10.08 |
P-value | <0.001 |
Degrees of Freedom (df) | 59.3 |
Confidence Interval Lower | 2345.2 |
Confidence Interval Upper | 3506.7 |
Method | Welch Two Sample t-test |
Alternative | two.sided |
Interpretation:
The p-value is below the 0.05 significance threshold, indicating a statistically significant difference in mean planet mass between the two methods. Planets discovered via Imaging tend to be significantly more massive than those detected by Radial Velocity. The confidence interval further confirms this result, as it does not contain zero.
A corresponding box plot visualizes the mass distribution:
Together, these findings reinforce the conclusion that detection methods influence the type of planets observed, likely due to instrumental and methodological sensitivity.
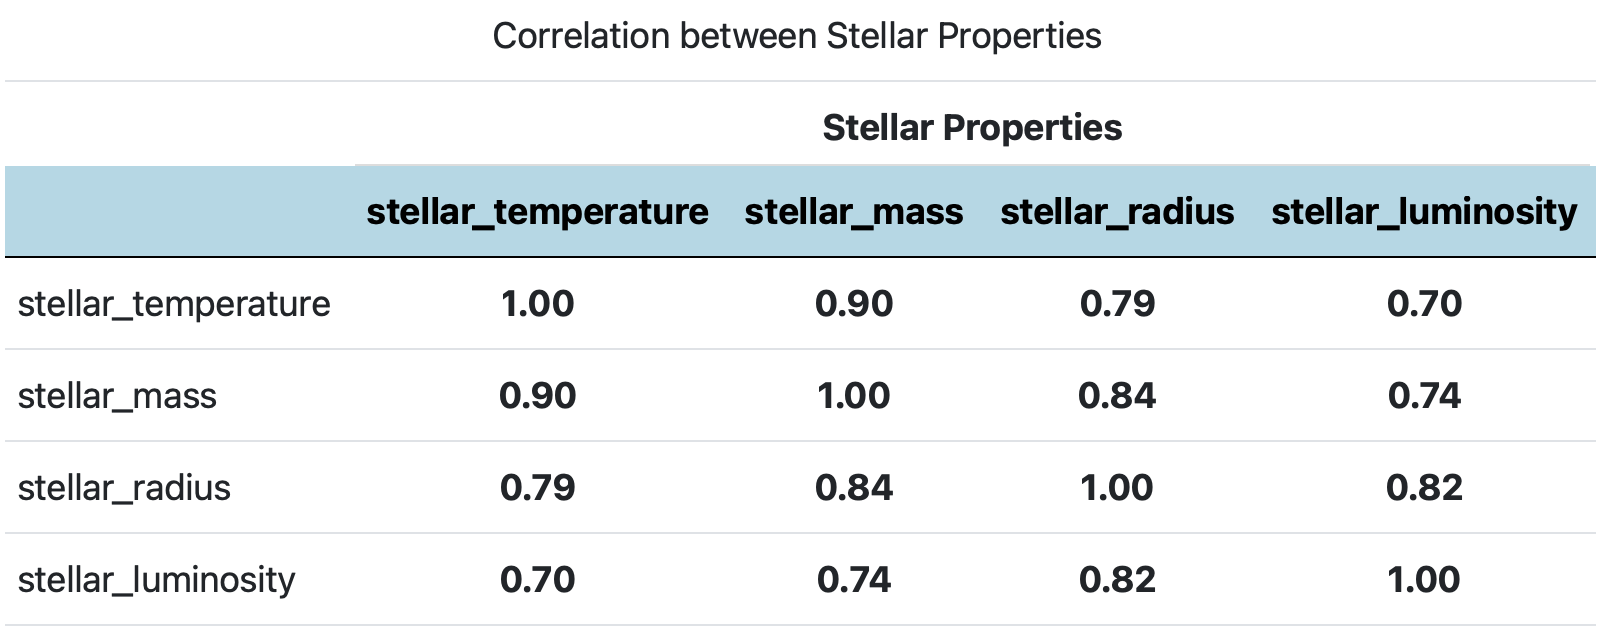
A correlation was computed for key stellar variables: mass, radius, temperature, luminosity.
Interpretation:
These strong correlations affirm the physical interconnectedness of stellar properties. More massive stars tend to be hotter, larger, and more luminous, which reflects well-established stellar structure theory and supports the use of these predictors in our regression modeling.
To assess whether the size of orbiting planets is associated with the stellar mass group of their host star, we binned both variables and conducted a Chi-Square Test.
Interpretation:
The test result is highly significant, providing strong evidence of an association between stellar mass group and planet size category.
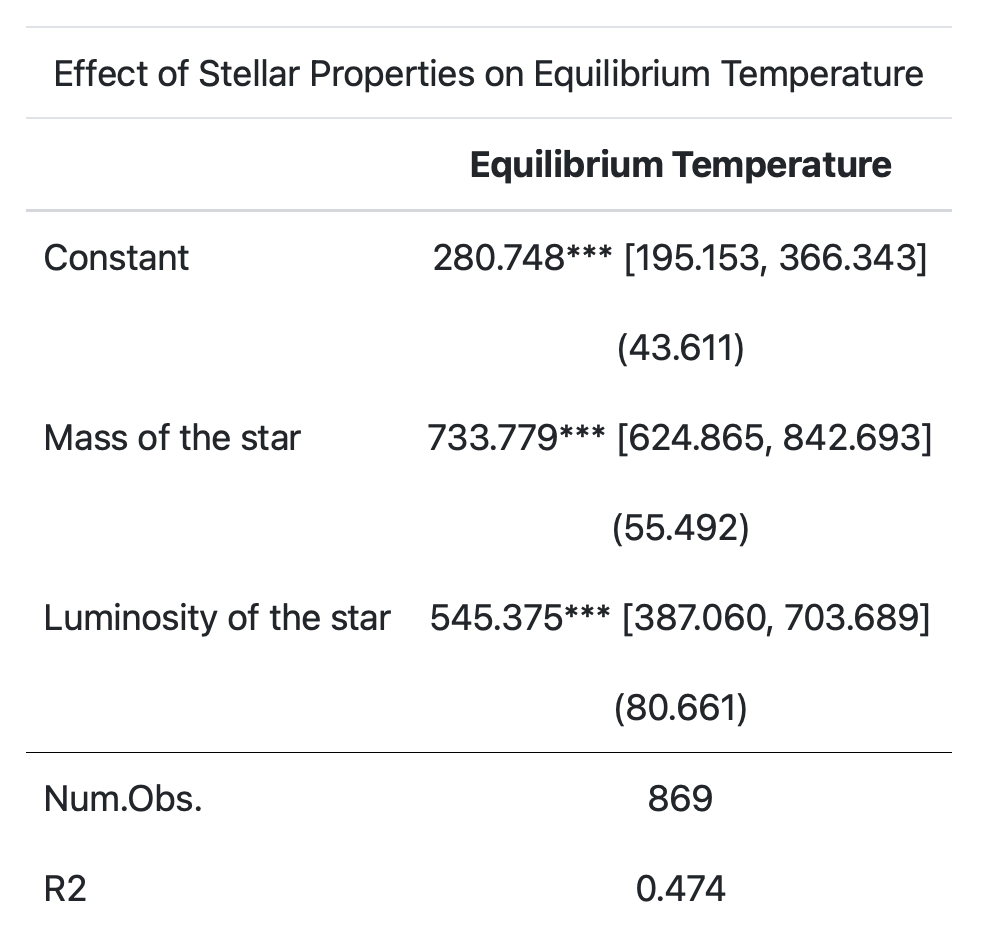
To examine how stellar properties influence a planet’s equilibrium temperature, we built a multiple linear regression model using stellar mass and stellar luminosity as predictors.
Model Coefficients
To evaluate the validity of the model assumptions, we assessed diagnostic plots:
The regression model reveals a strong positive relationship between stellar characteristics and planetary equilibrium temperature. The significant coefficients and moderate R² value suggest that both stellar mass and stellar luminosity are meaningful predictors, consistent with theoretical models in astrophysics. Furthermore, residual analysis indicates that regression assumptions are largely met, supporting the model’s validity.
This study explored the relationships between stellar properties and planetary equilibrium temperatures using data from the NASA Exoplanet Archive. Through exploratory analysis, correlation testing, and regression modeling, we identified meaningful patterns that support current astrophysical understanding.
We found strong positive correlations between stellar mass, temperature, radius, and luminosity, all of which were consistent with theoretical expectations (Schneider & Arny, 2021). Our multiple regression model confirmed that stellar mass and luminosity significantly predict a planet’s equilibrium temperature, explaining approximately 47.4% of the variation. Residual analysis supported the validity of the model, though minor issues like non-normality and heteroscedasticity were noted.
A t-test showed a significant difference in planet mass based on the discovery method: Imaging techniques revealed significantly more massive planets than Radial Velocity, likely due to instrumental biases (NASA, 2024). A chi-square test reveals that higher-mass stars are more likely to host larger planets, consistent with theory.
Future work could improve modeling by incorporating nonlinear terms, interaction effects, or advanced methods such as machine learning. Adding variables like atmospheric composition, orbital eccentricity, or albedo would provide a more complete picture of planetary diversity (Palen & Blumenthal, 2022).
As astronomical datasets continue to grow, the integration of statistics and astrophysics will be essential to uncover the complexity of planetary systems.